Resource Monitoring
This guide will walk you through determining how many resources you should request, what resources are available, and how to monitor your resource consumption once running. Once you have completed this guide you should be able to:
- Determine the resources you should be requesting
- View available resources on the Nautilus portal
- View the CPU and GPU resources you are consuming on Grafana
Prerequisites
This documentation assumes that you have:
- Completed either the JupyterHub or Batch Jobs Getting Access guide
Minimum, average, and maximum resource usage
All software requires some computer hardware resources to run properly. Since the computer hardware in the cluster is a finite resource, it’s extremely important to request only the resources that your application needs. If your request is too large, it may not be scheduled on the cluster; too small, and your application may not run properly. Determining the correct resource request requires a good understanding of your applications’ minimum and average resource consumption. More details can be found on Nautilus’ memory allocation policies.
Minimum resource usage
The minimum resource requirements are what your application requires to start up. This means that, if you had the minimum requirements for your program, the program could start without anything else running. It’s imperative that the resources you request are greater than the resources required to start your program. You can determine the minimum hardware requirements for most software applications by searching <your app> minimum hardware requirements.
For example, performing this search for Python yields 2GB of memory and 1 CPU. If we requested these resources we’d likely be able to start Python and perform a simple operation like 1+1, but anything more would require more resources.
Average/runtime resource usage
As you begin to use your application it will consume more resources. A great example of this would be loading a large file in code. If your program needs to load a 4GB file, you will need at least 4GB of additional memory since the entire 4GB file is being loaded into memory alongside your application.
This applies to the CPU side as well: any additional operation on top of running your application will require additional CPU. For example, if you start your application without increasing your CPU from its minimum requirements then try to compute the millionth digit of pi you will likely run out of CPU.
If you’d like to see what resources your application is currently consuming see monitoring resource consumption.
Maximum resource usage
Maximum resource usage refers to the peak usage over the lifetime of your program. If your program averages 6GBs of memory consumption while running then takes 12GBs for a few seconds to load a new file, your maxiumum resource usage would be 12GB.
Does my application need a GPU?
How do you know if your application needs a GPU? CPUs are great for general purpose processing, everything needs a CPU to run. On the other hand GPUs are great at parallel processing, meaning they can handle many small calculations happening at once. If you’re not sure, you most likely don’t need a GPU. Some examples of applications that require GPUs could be processing large amounts of images/video, training a machine learning model, or performing simulations.
Available resources on Nautilus
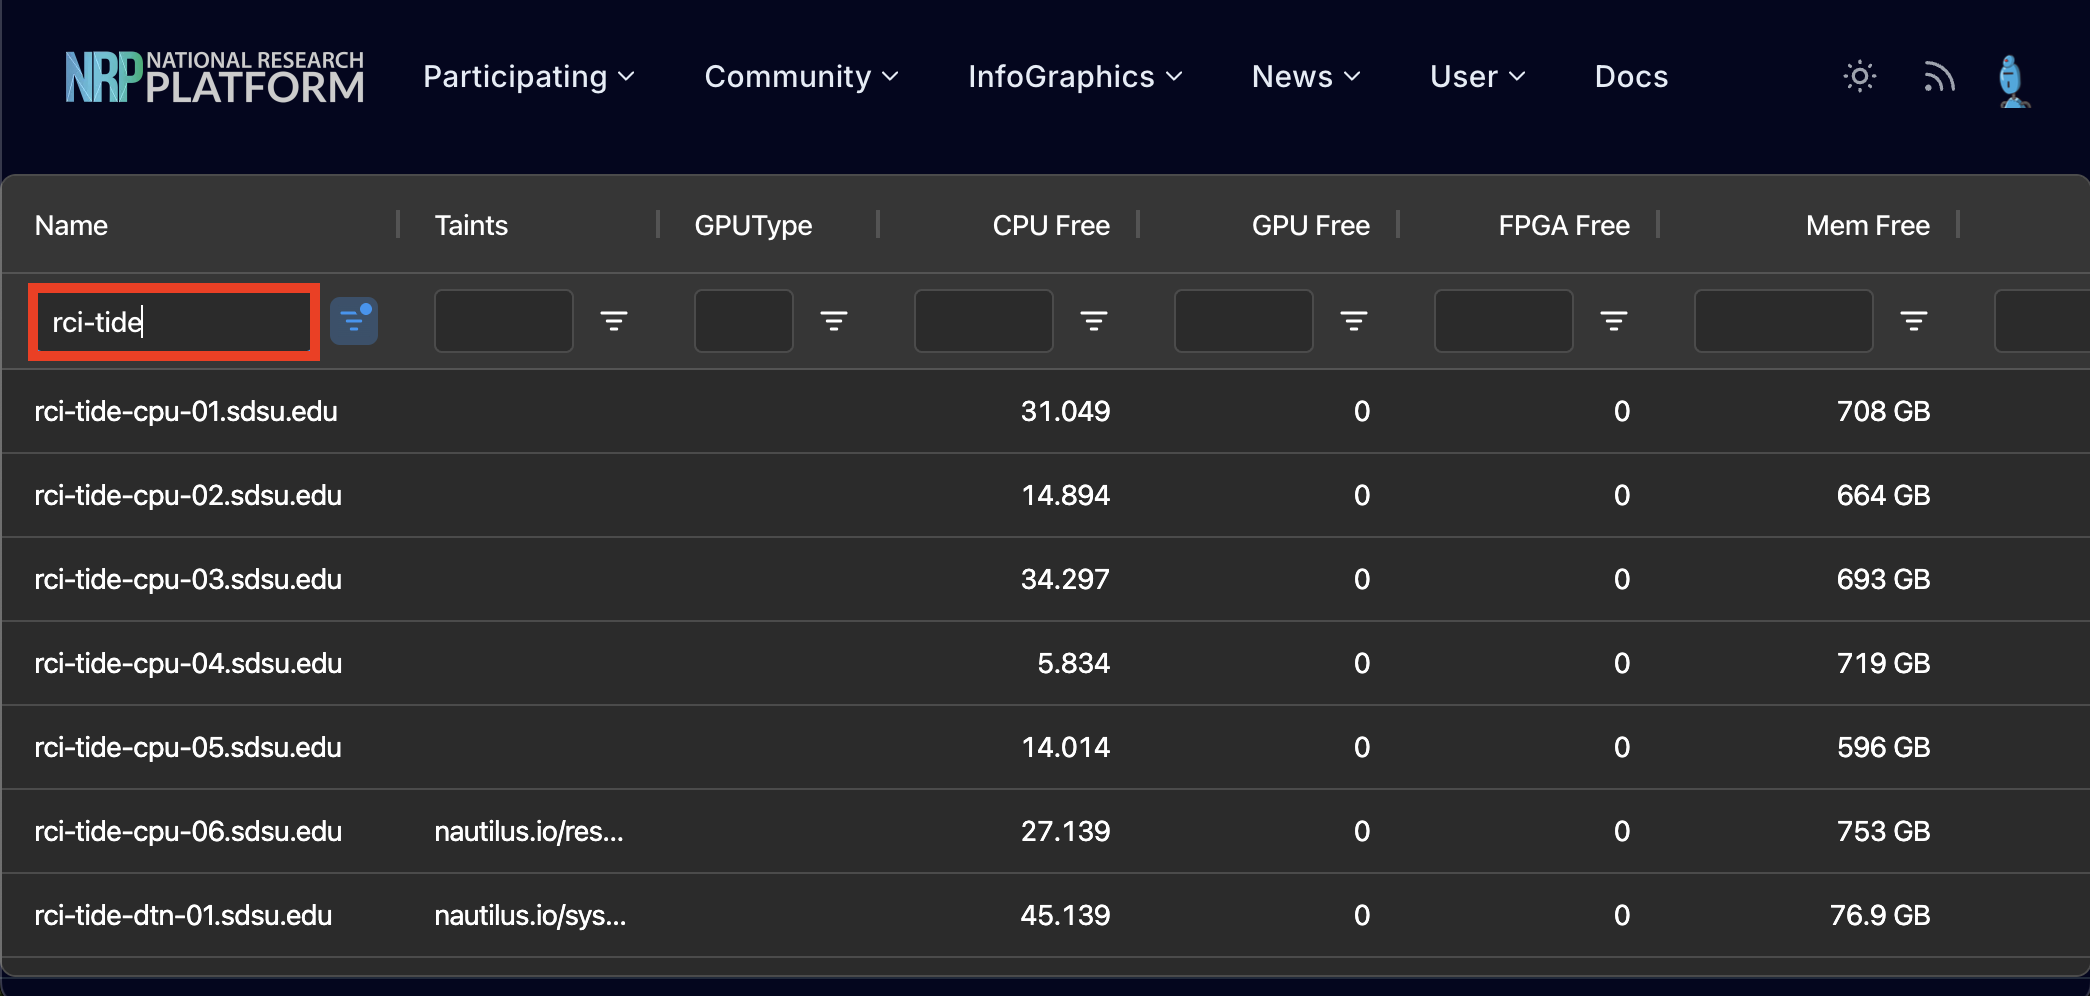
Nautilus provides a resources page that outlines all of the nodes in the cluster and their available resources. A node is another word to describe the computer that the servers are running on, with each row in the table corresponding to a node in the Nautilus cluster. If the resources you are requesting are not available, then your job or notebook may not schedule. You can use this resources page to see what is schedulable in real-time.
The true CPU count you can reserve will be 2 less than what is shown, this is because each node reserves 2 CPUs for batch jobs with partial CPU requests. Available RAM and GPU will be exactly as listed.
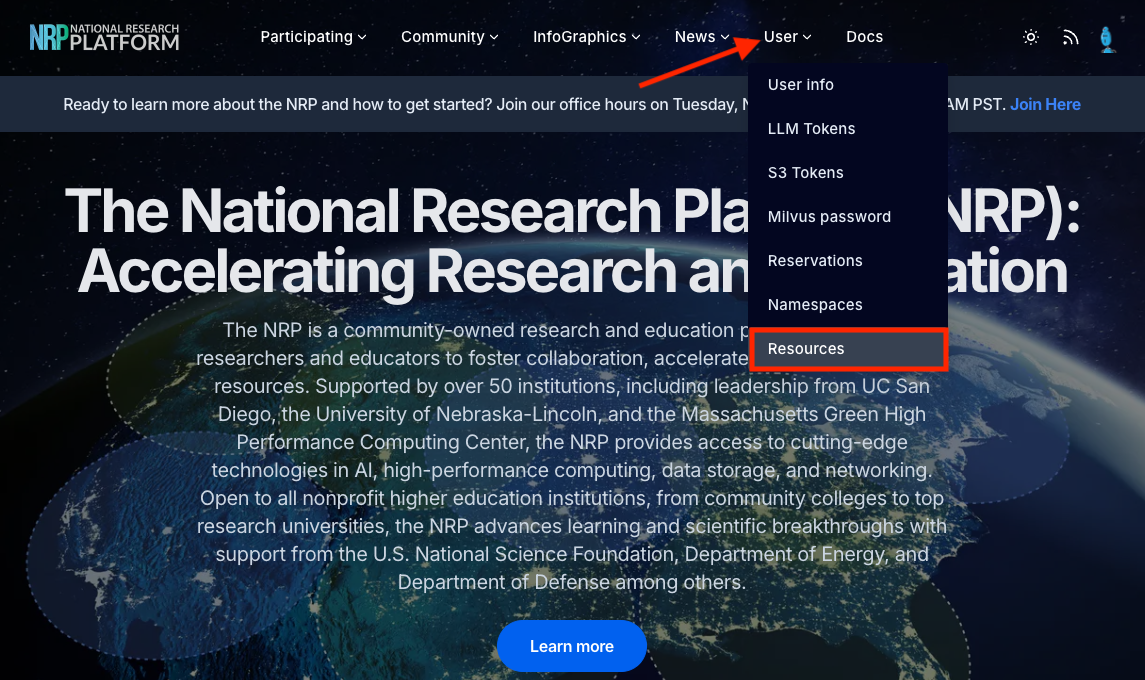
- Navigate to https://portal.nrp-nautilus.io/.
- Click on the Resources tab.
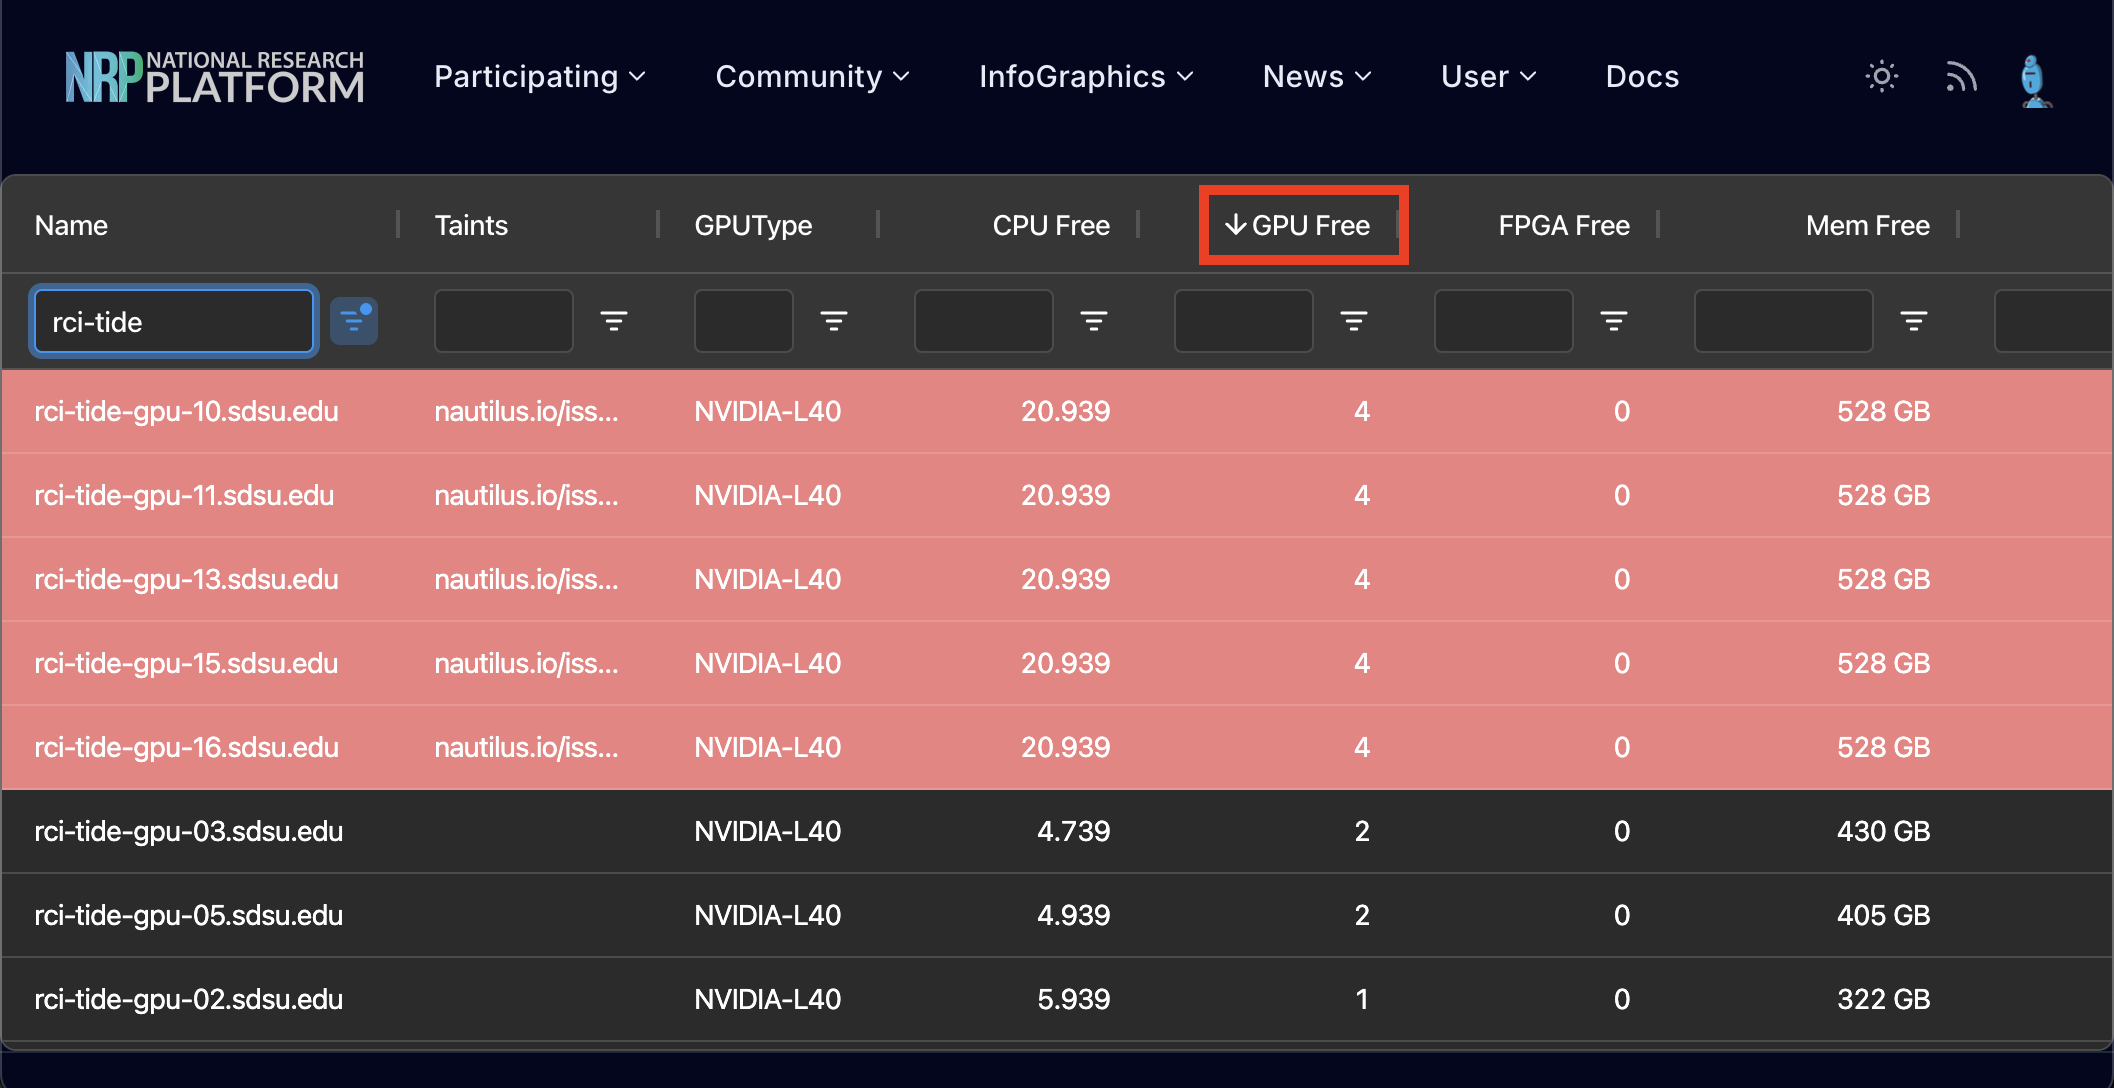
- Notice the table is filled with all nodes in the cluster, refine your results by putting
rci-tidein the Name entry section. - You can check the amount of CPU, GPU, and memory resources available by sorting the respective column that you’re looking for. In general, GPUs are in the highest demand, CPUs in the middle, and memory in the least demand.
- Sorting the available resources by GPU:
Monitoring resource consumption with Grafana
With Grafana, you can observe your namespace’s resource consumption.
Prerequisites
This section of the guide requires knowledge of the namespace and pod name that your application is running on. In the simplest of terms, a namespace represents a grouping of pods; a pod is an instance (usually belonging to one person) that can run an application. If you don’t know these values, the finding namespace and pod names section may help.
Finding namespace and pod names
| Service | Namespace | Pod name template | Pod name example |
|---|---|---|---|
| CSU TIDE JupyterHub | csu-tide-jupyterhub | jupyter-[SSO-ID-URL-Encoded] | jupyter-abc12-40humboldt-2eedu |
| SDSU Research JupyterHub | sdsu-rci-jh | jupyter-[SDSUid-prefix]-40sdsu-2eedu | jupyter-kkrick-40sdsu-2eedu |
Monitoring CPU/Memory consumption
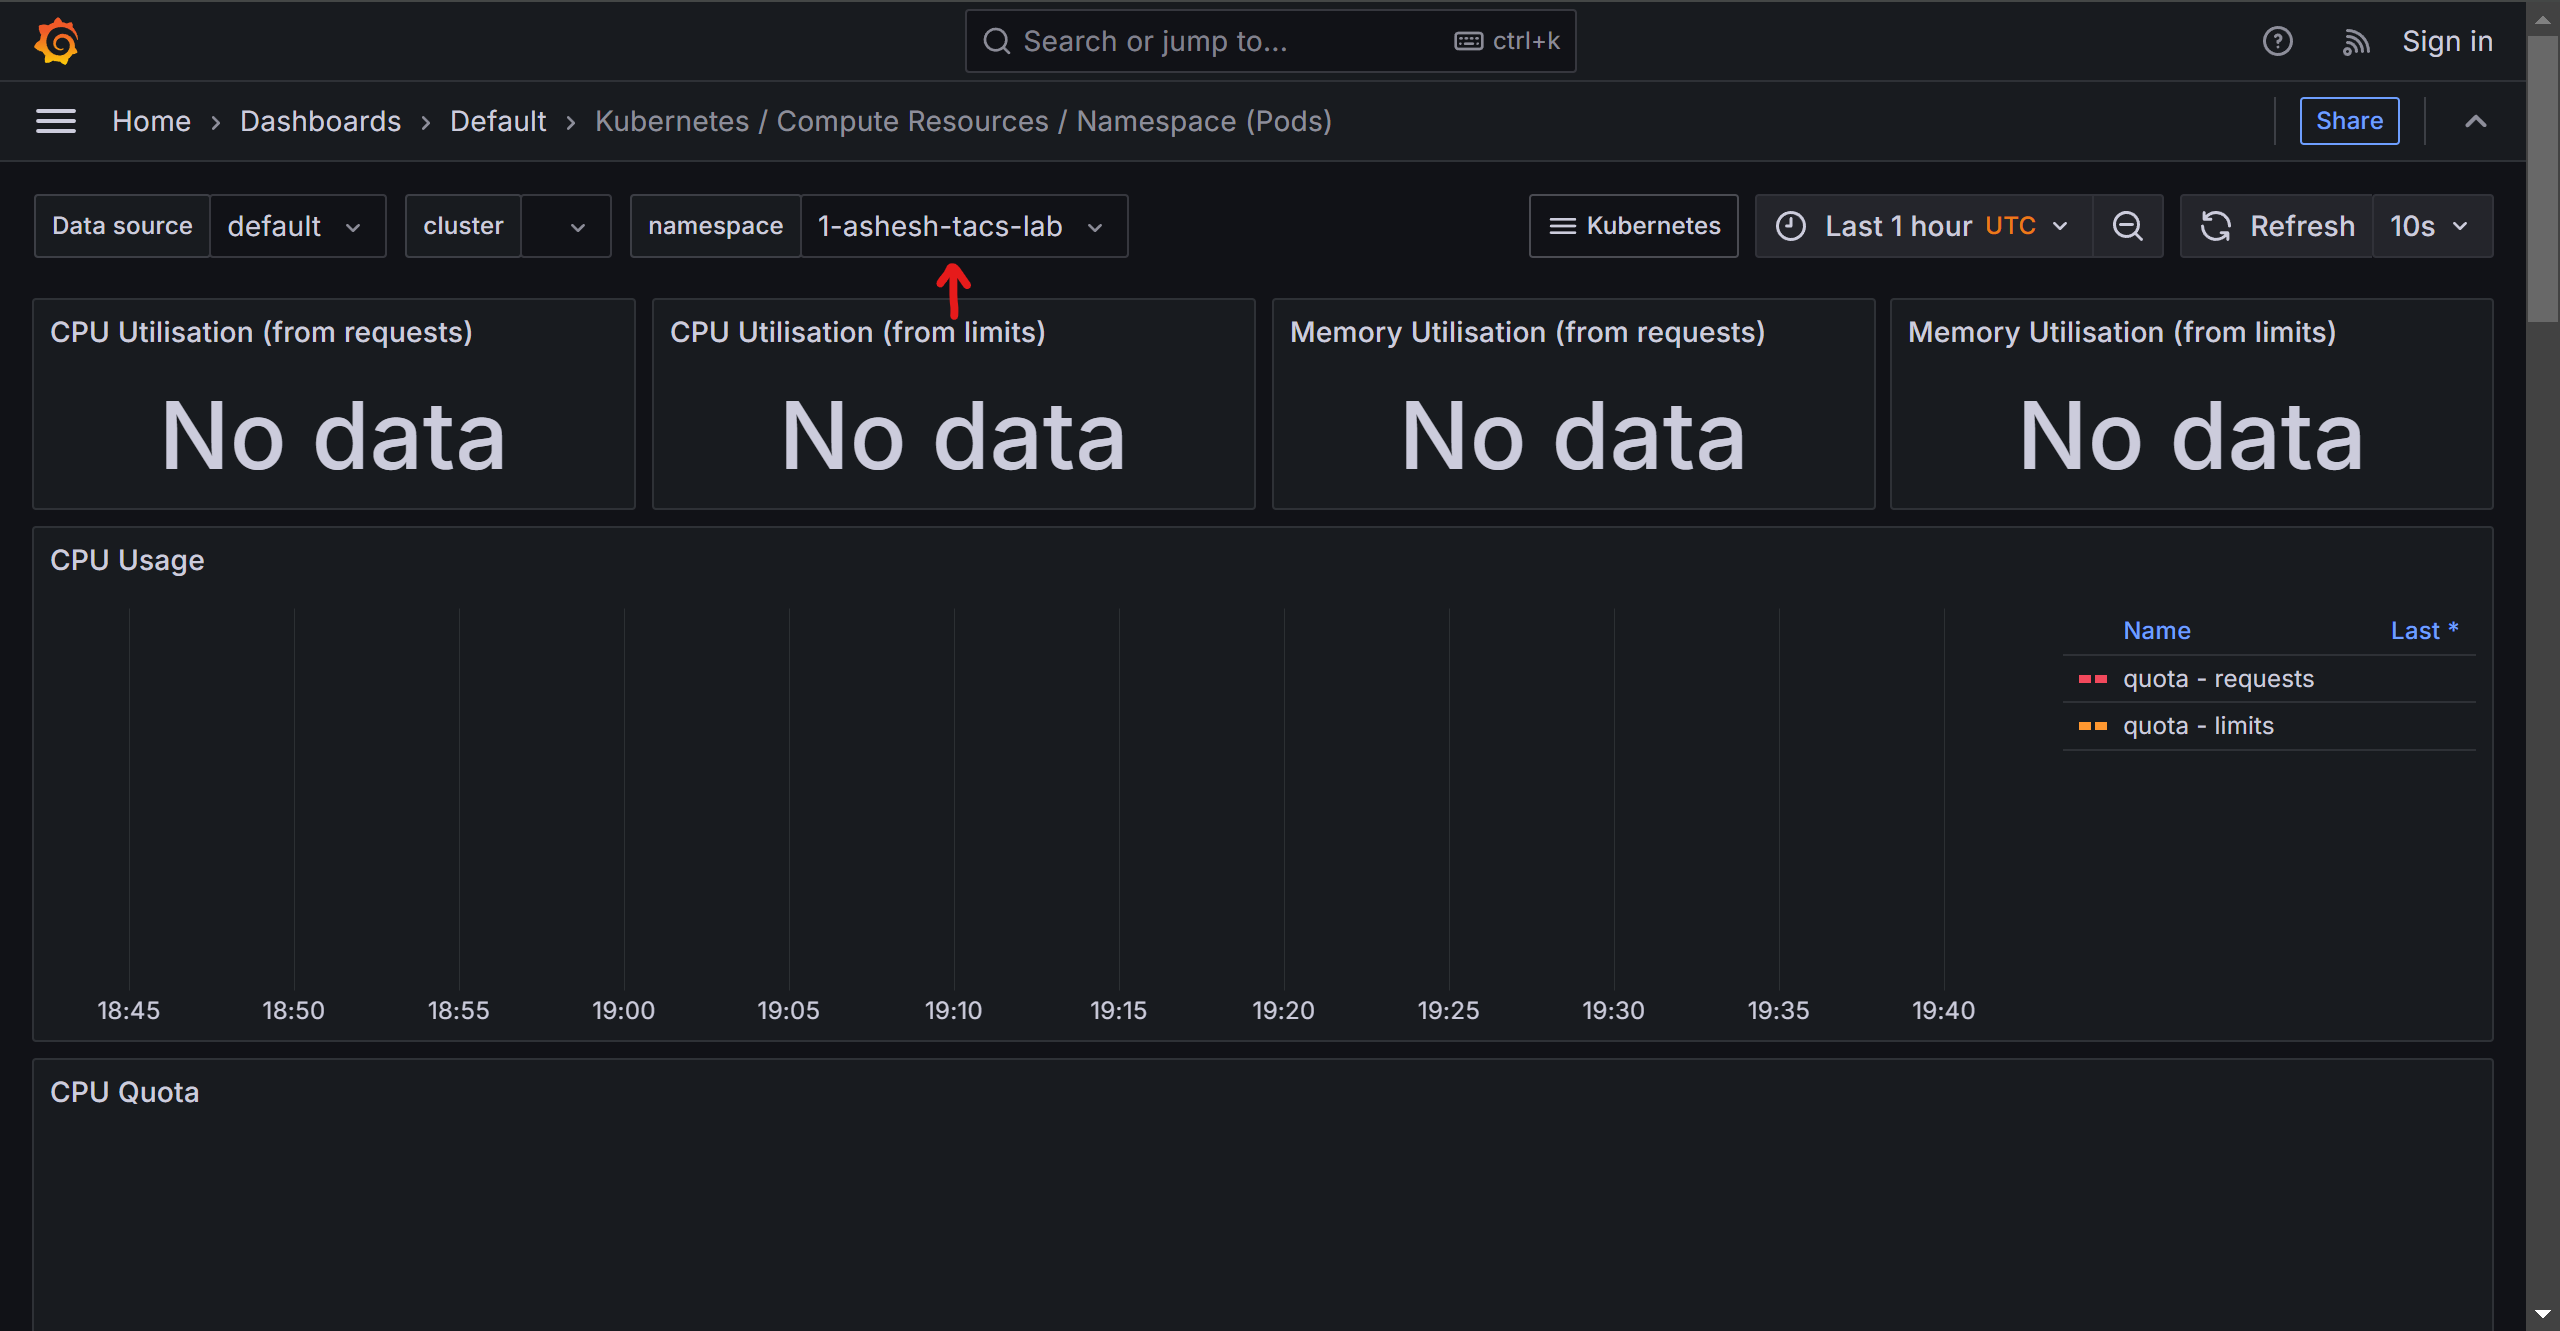
- Navigate to the Nautilus CPU/memory dashboard.
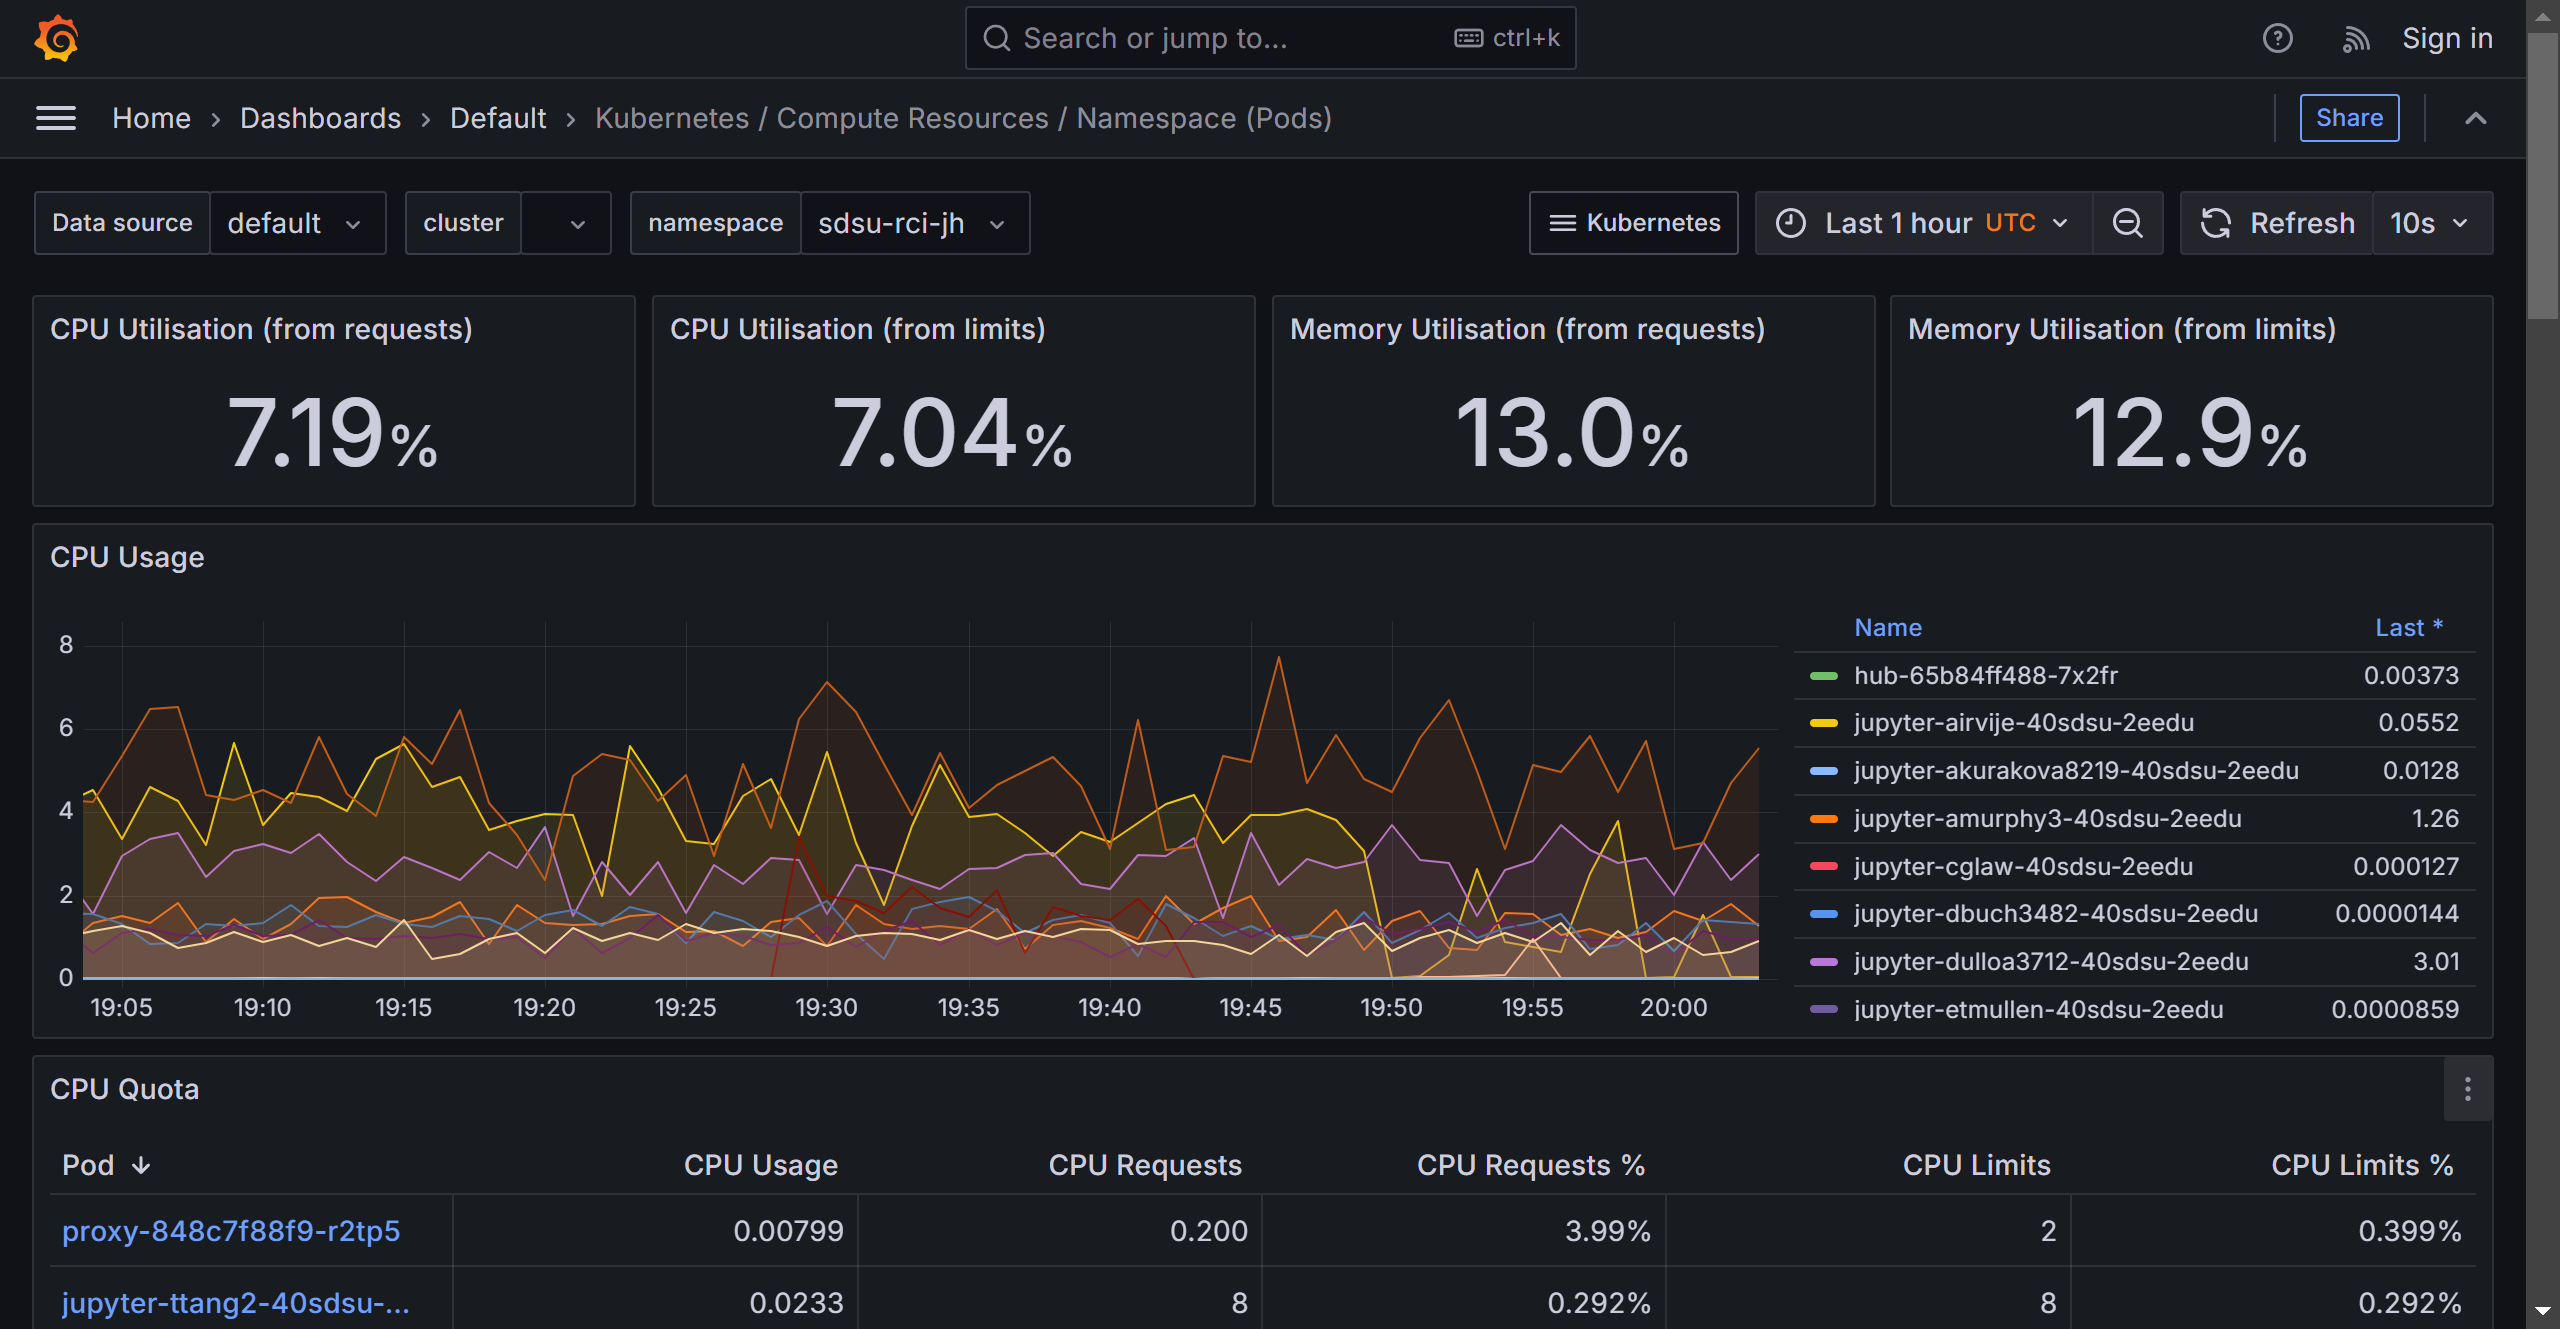
- You will see an empty page showing “No Data.” This is because we haven’t entered a namespace yet. Enter your namespace in the box near the top.
- Once your namespace is selected, you can see all the pods running in that namespace- highlighted in the box on the right.
- Scroll down slightly and find your pod name in the box highlighted red, you may need to scroll or sort alphabetically to help your search. Selecting your pod name will take you to a page that only contains your pods information.
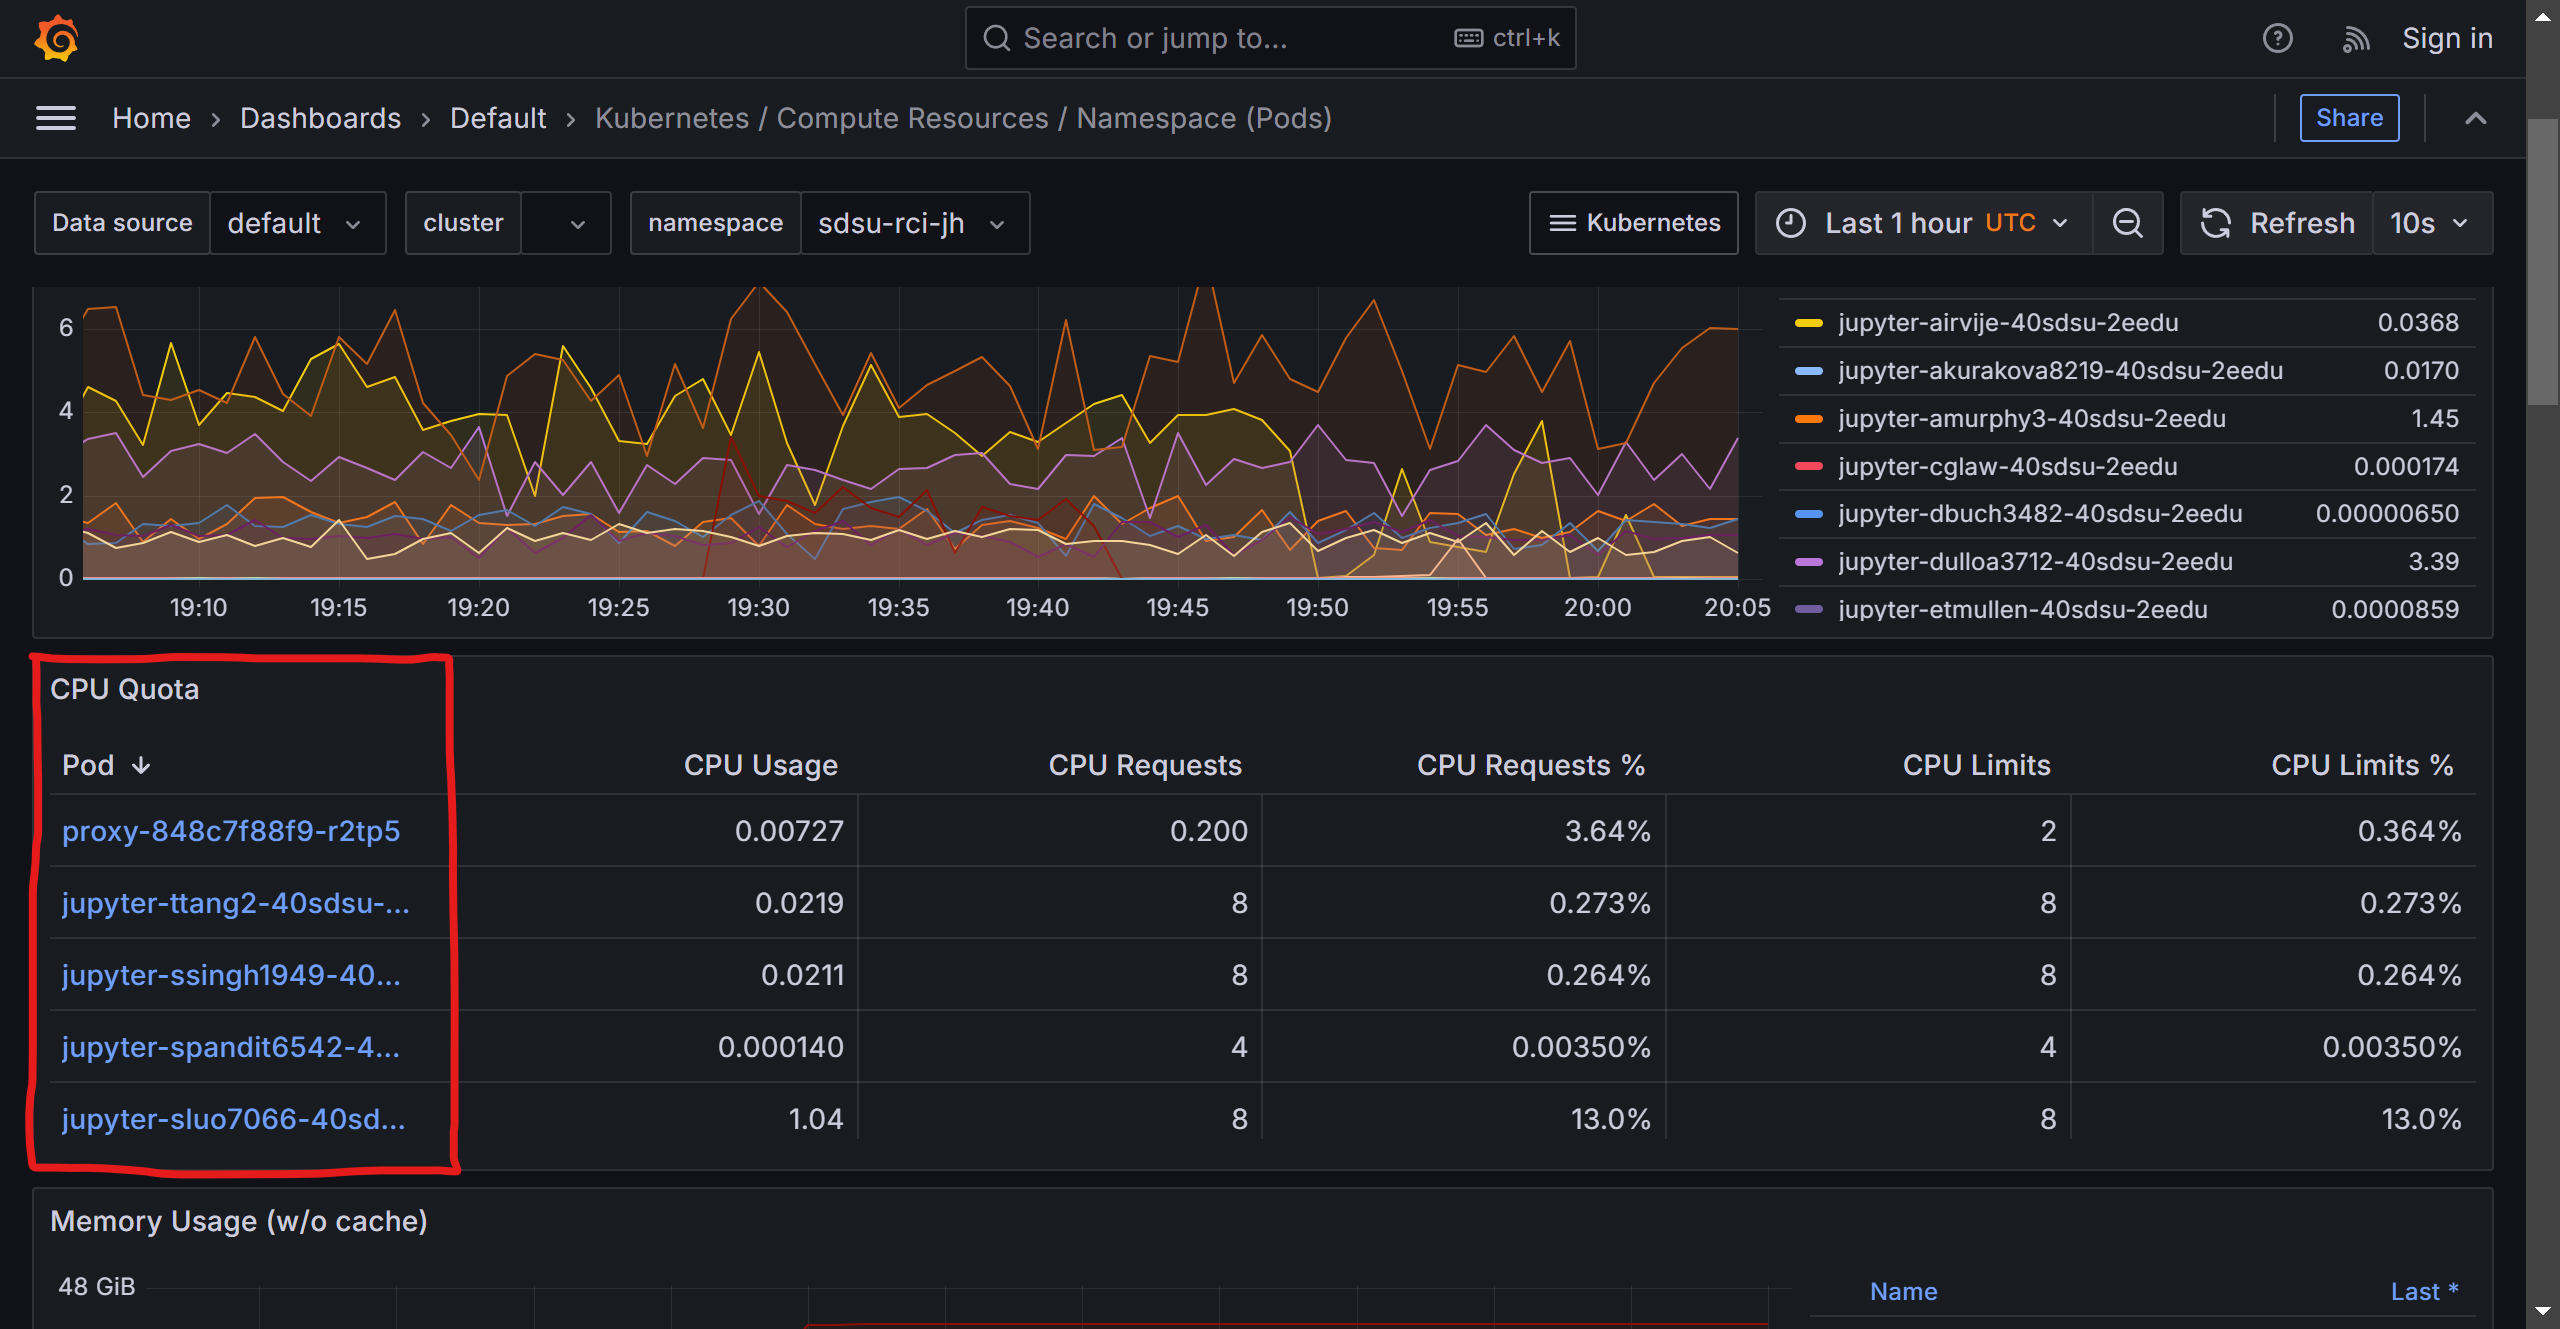
For more information, including documentation on determining usage with Tensorboard, see Nautilus’ monitoring documentation.
Monitoring GPU consumtion
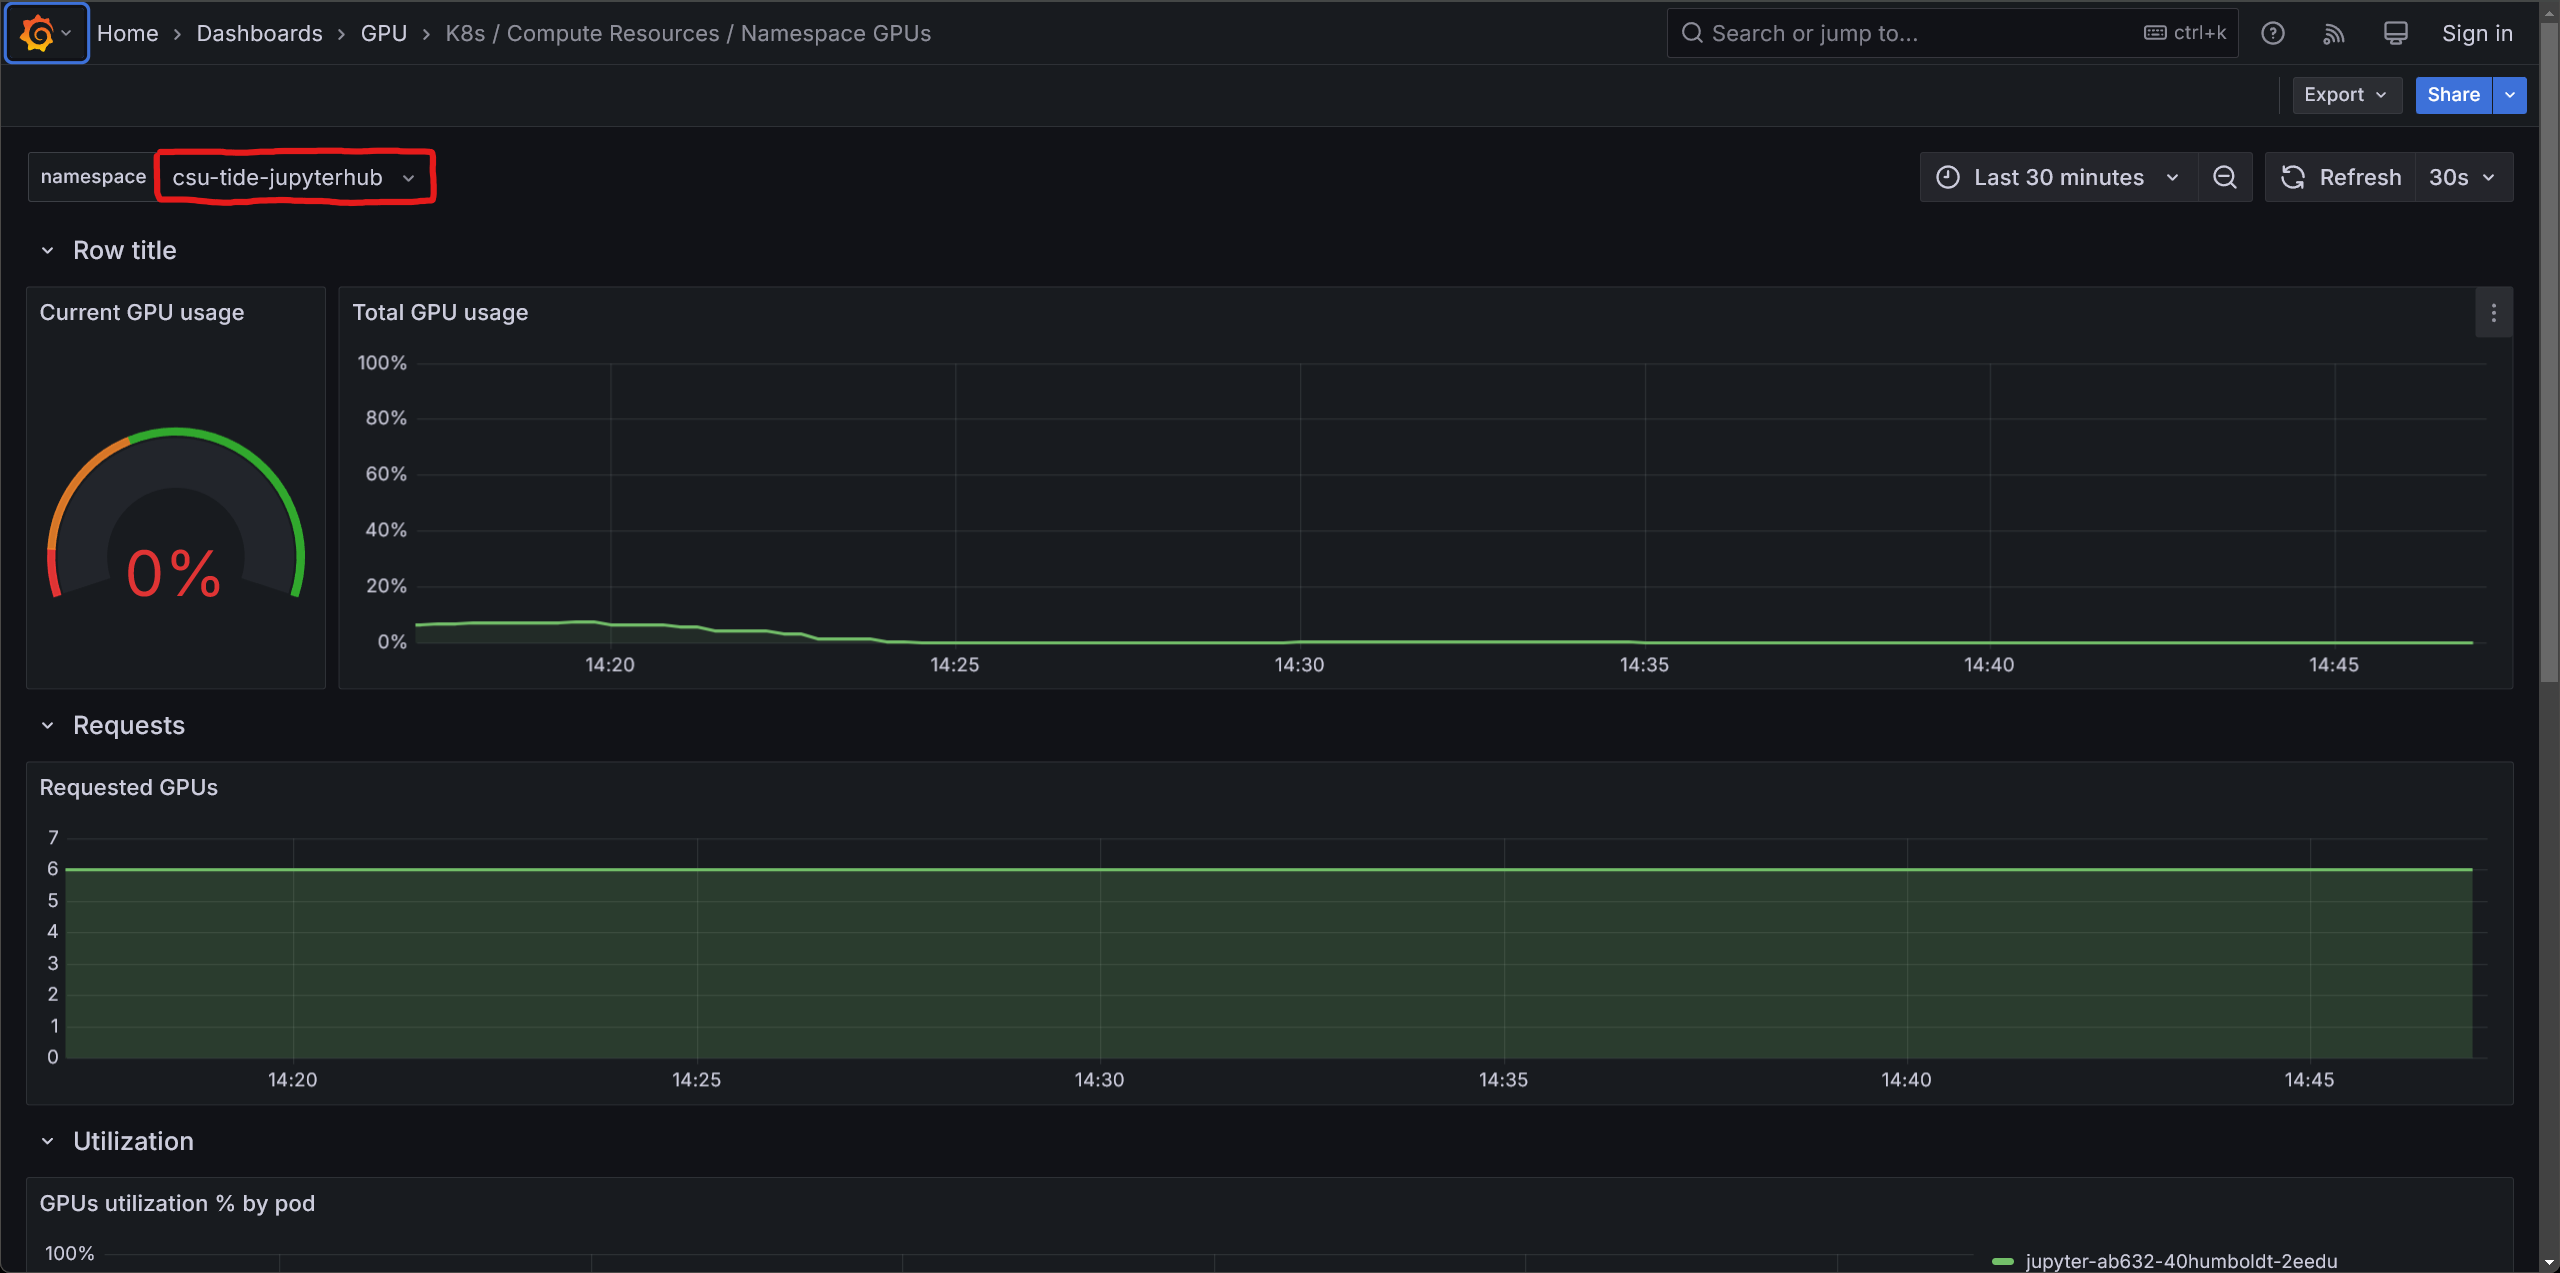
- Navigate to the Nautlius GPU dashboard
- The page might be populated with data that you’re not interested in. Make sure your namespace is selected in the top left
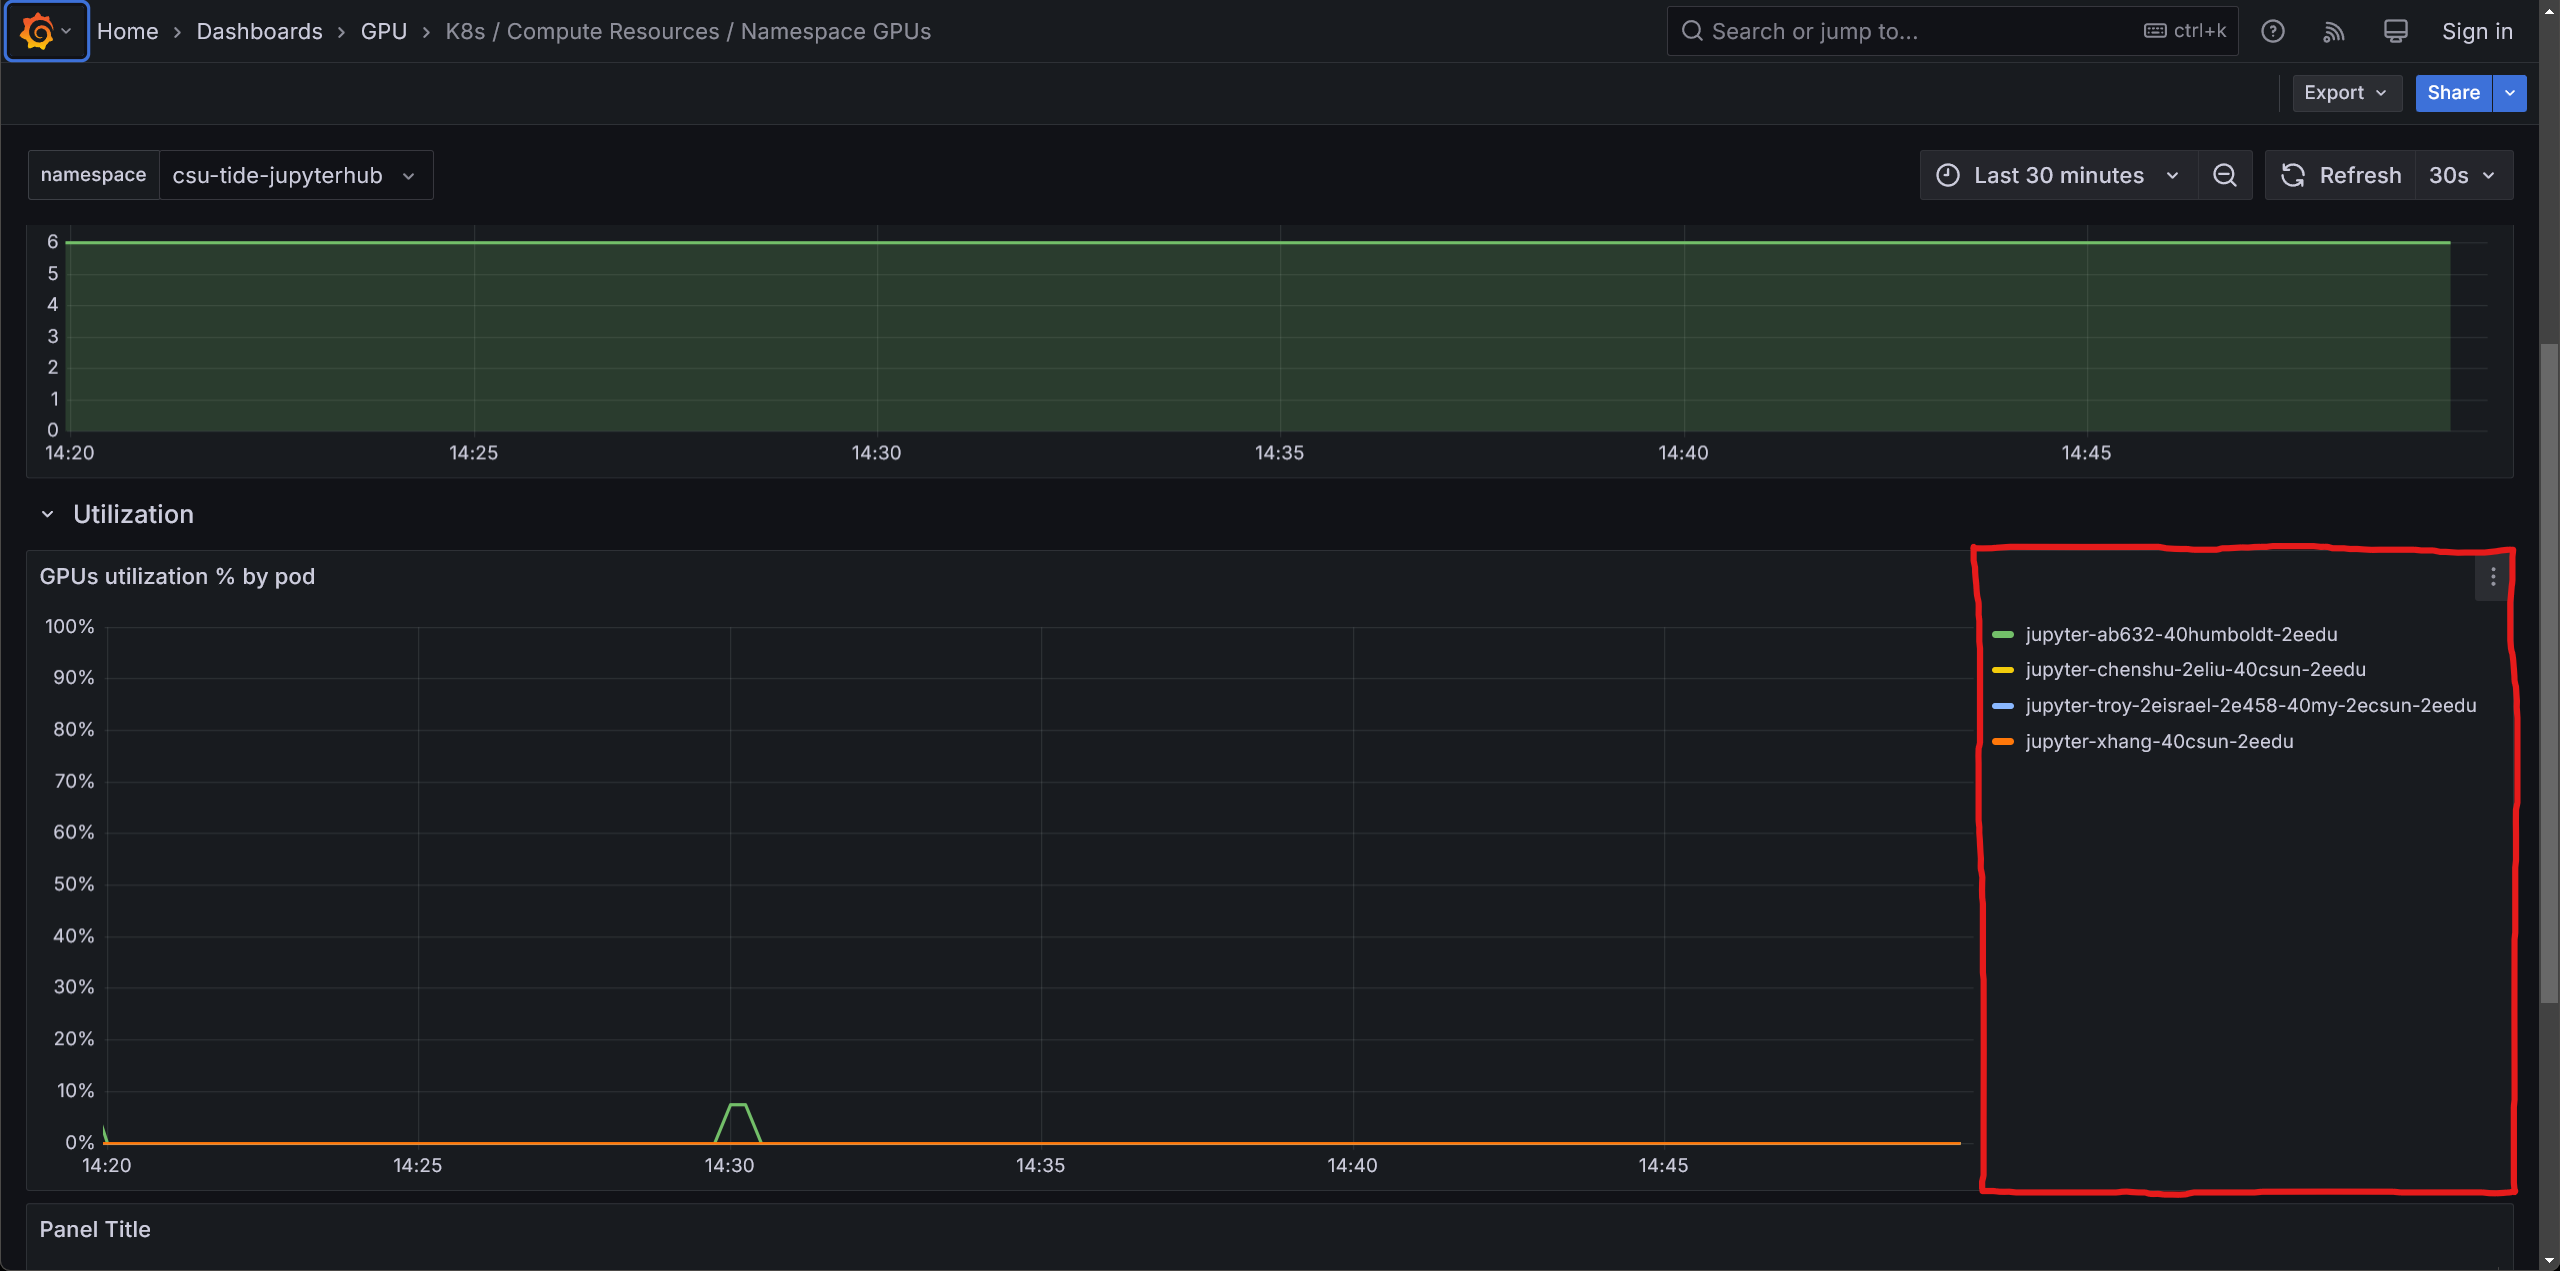
- Scroll down slightly and find your pod name in the box highlighted red, you may need to scroll or sort alphabetically to help your search. Selecting your pod name will take you to a page that only contains your pods information.